Although Iterum 24 was recently introduced, we made minor changes by adjusting some symbols, converting all factors to positive values and… translating the description to English.
starting point
According to the definition in ISO 12100 (the base for all other machinery safety standards), risk is a combination of the severity of harm and the probability of its occurrence. The same approach is found in ISO 13849-1, although instead of probability, it refers to frequency (i.e. the number of hazardous events per unit of time).
The higher the risk, the greater the risk reduction required — in other words, the lower the allowable failure rate of the protective measures.
ISO 13849-1 offers a graph1)Annex A.1 to determine the required Performance Level (required PL, or PLr), based on three key parameters: severity of harm S, frequency of exposure F, and the possibility of avoiding harm A.2)actually, in the standard „P” is used as a symbol; but P can stand for both probability of occurrence and possibility of avoiding, later on
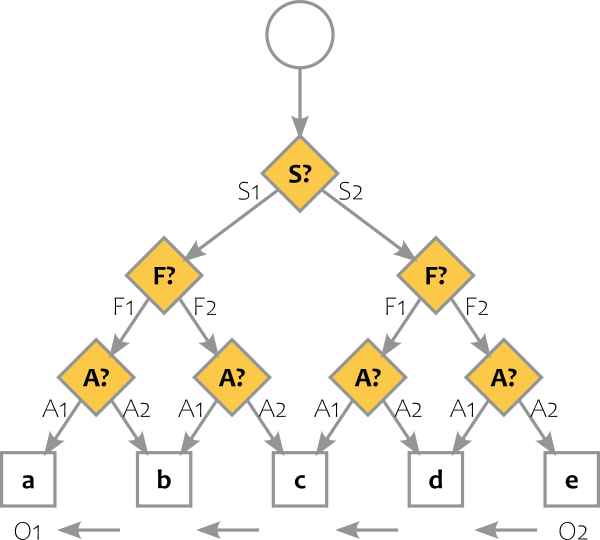
Additionally,3)Annex A.2:2 the probability of the hazardous event occurrence — let’s call it O — may be considered. If it’s low (whatever that means), it allows the required PL to be reduced by one level.
numerical representation
Increasing severity from low (S1) to high (S2) raises the PLr by two levels, while changing any other parameter (F, A, O) affects it by one. Instead of adding a new layer to the graph to account for O, a simple formula can be used:
R = S + O + F + A,
where S takes values like 0 or 2, and the others either 0 or 1. In that case, values of R from 1 to 5 would4)would, not does — as eventually other values will be chosen to represent the parameters correspond to PLr from a to e.
extrapolation
PL 0
We need to extend the PL scale downwards, to account for PLr „one level lower” than PL a (i.e. S1, F1, A1, and O1). Less then the lowest possible cannot mean anything but no performance level required at all.
S0
In the standard, hazards (S) are can be slight (S1) or serious (S2). If “slight” is taken to mean “reversible,” then we also need a value for negligible hazards, like scratches or bruises — let’s call it S0. To avoid using negative values, let the S values be: S0 = 0, S1 = 1, and S2 = 3.
F0
The boundary between low and high frequency (F) in the standard is 15 minutes. But some exposures are much less frequent — e.g. once a day or even once every few weeks. Let’s introduce F0 for such low frequencies and the following values: F0 = 0, F1 = 1, F2 = 2.
| parameter | values |
|---|---|
| S | 0, 1, 3 |
| F | 0, 1, 2 |
| A | 0, 1 |
| O | 0, 1 |
In this model, PL a corresponds to S = S1 = 1, F = F1 = 1, A = A1 = 0, O = O2 = 1 → so R = 3. Lower values imply no PL required; higher values point to higher PLs.
R0 = 2 will be used as a symbol of the highest R value that does not require any PL.
| R | R – R0 | PL |
|---|---|---|
| 0 | -2 | – |
| 1 | -1 | – |
| 2 | 0 | – |
| 3 | 1 | a |
| 4 | 2 | b |
| 5 | 3 | c |
| 6 | 4 | d |
| 7 | 5 | e |
risk evaluation
The value of R is considered the measure of risk.
acceptability of risk
It’s natural to regard risks that don’t require any performance level — i.e. R ≤ R0 — as acceptable.
Note also that PL c is typically required by harmonised standards; PL a and PL b are rarely used and generally apply to components that don’t pose significant risk. So if PLr is below PL c (i.e. R = 3 or R = 4), the risk may be considered conditionally acceptable.
| R | risk | acceptability |
|---|---|---|
| 0..2 | very low | acceptable |
| 3 | fairly low | conditionally acceptable |
| 4 | significant | conditionally acceptable |
| 5..7 | high | unacceptable |
risk reduction
ISO 13849-1 requires protective measures with a given level of performance, depending on the risk level. This also implies that if a protection with the required PL is applied, the risk is reduced to an acceptable level.
Let’s define the parameter M — effectiveness of the protective measure or risk mitigation — using values that match the R-to-PL table: from 1 to 5 for PL a to PL e.
The final risk formula becomes:
R = S + O + F + A – M.
To avoid confusion, let’s distinguish between the initial or raw risk Rr, which excludes protective measures, and the actual risk Ra:
Rr = S + O + F + A,
Ra = S + O + F + A – M.
The Rr (theoretical) is only used to determine the required PL. Actual risk Ra describes the real situation.
If the safeguarding is weaker than required (M < Rr – R0), then Ra > R0, meaning the actual risk is above the acceptable threshold — which makes intuitive sense.
When assessing the (theoretical) risk, having the recommended protection applied, we can speak of final risk Rf, calculated the same way as Ra.
interpretation
The meaning of the numerical parameter values is explained in the following tables.
potential harm
The standard only provides extreme cases — death or amputation corresponds to S2, while bruises and cuts are classed as S1. But how should a fracture be classified? The only hint is a reference to ISO/TR 14121-2,5)6.3.2 where a similar graph with two severity levels can be found. The distinguishing criteria are:
- reversibility,
- inability to work for no more than two days.
Following this line of reasoning, the injuries that do not cause any work incapacity, requiring at most basic first aid –are classified as minor (S0). That’s why bruises and cuts, although mentioned in the standard as examples of S1, are placed in the lower group.
| S | severity | criteria | examples |
|---|---|---|---|
| 0 | minor | no work incapacity | cuts, bruises, first-degree burns (occasionally second-degree) |
| 1 | reversible | incapacity ≤ 2 days | lacerations, second-degree burns (occasionally third-degree) |
| 3 | irreversible | incapacity > 2 days | fractures, crush injuries, amputations, damage to sight or hearing, third-degree burns, disfigurement, death |
exposure
The frequency of potential faults (PFHd) for different performance levels roughly follows a geometric progression: 10⁻⁴, 10⁻⁵, 3×10⁻⁶, 10⁻⁶ and 10⁻⁷. The ratio between adjacent levels does not exceed 10:1. Similarly, the same geometric progression (with the same ratio) of the exposure frequency values assigned to each F level can be assumed.
According to the standard, the threshold between F1 and F2 is exposure once every 15 minutes. Ten such intervals make 2.5 hours. A full day consists of about 100 such intervals. No one can accuse us of being careless if we adopt an even lower frequency — say, once per week — for F0.
In addition, this frequency threshold (once a week) is explicitly mentioned in ISO 14120 as allowing for the use of fixed guards.
| F | frequency | criteria |
|---|---|---|
| 0 | rare | ≤ 1 week⁻¹ and ≤ 24 minutes per instance6)limited to 1/20 of a work shift, similar to F1 |
| 1 | often | ≤ 1/15 min⁻¹ and ≤ 24 min/shift7)1/20 of a work shift |
| 2 | frequent | > 1/15 min⁻¹ or > 24 min/shift |
possibility of avoiding
| A | avoiding | criteria |
|---|---|---|
| 0 | possible | a real chance exists to avoid the hazard |
| 1 | difficult | avoiding the hazard is scarcely possible |
probability of occurrence
The standard doesn’t define a threshold for low probability. However, as noted in the exposure section, a 10:1 ratio is the basic step between PFHd levels corresponding to performance levels. For this reason, the same ratio is used to distinguish between low and high probability.
| O | occurrence probability | criteria |
|---|---|---|
| 0 | low | ≤ 0.1 |
| 1 | high | > 0.1 |
protective measures
In addition to values directly corresponding to performance levels (PL a .. PL e), the table below suggests values of M for other protective characteristics. These values are based on experience with applying the method in practice.
| M | mitigation |
|---|---|
| 0 | no protective measures |
| 1 | PL a; hold-to-run control PL b; information about the residual risk; whole-body access; incorrect fixed access measures |
| 2 | PL b; hold-to-run control PL c; pre-start warning signal; access by limbs; stop time8)ISO 13855 exceeded twice; correct fixed access measures |
| 3 | PL c; hold-to-run control at least PL d; stop time exceeded |
| 4 | PL d |
| 5 | PL e |
| 6 | Fixed guard |
| +1 (increase) | non-interlocked movable guard; type-C standard does not require technical protective measures |
| -1 (decrease) | no residual risk information; poor ergonomics |
| -2 | no complementary protective measures |
| -2 | procedure required (e.g. LOTO) |
invitation to discussion
The presented method is a natural extension of the graph in ISO 13849-1, but some elements were adopted arbitrarily — particularly the assignment of protective features to specific performance levels (table M). The introduction of an additional severity level (S0) may also be a point of contention.
Everyone is encouraged to give a try to this method and leave a feedback here.
Photo by vasantdave on Freeimages.com
Przypisy
W odpowiedzi na “SOFA as a risk assessment kit — Iterum 24.4”
Up-to-date version of the method and the withdrawn versions are available at:
Aktualna wersja metody oraz wersje poprzednie są dostępne na stronie projektu: